R & Twitter: statistics and word-cloud
Twitter Analysis with R
Анализ коротких сообщений в Twitter на основе R
Connect to Twitter
consumerKey"55ZCRbatWWVYpr2VU9Ddk1234"
consumerSecret"ji4Zqit6jL7iIoegHKr3zVBoCTEeYSnmH0aAJdm3j3gRZRFlL7"
setup_twitter_oauth(consumer_key=consumerKey,consumer_secret=consumerSecret)
and/or
or
cc1 = ggplot(data1, aes(created))
cc1 + geom_histogram()
and/or
ggplot(data1, aes(data1$created,data1$retweetCount)) + geom_line()
setup_twitter_oauth(consumer_key=consumerKey,consumer_secret=consumerSecret)
Search Tweets
tweets1 = searchTwitter("business analytics", n=250)Twitter List to Data Frame
data1 = twListToDF(tweets1)Plots
qplot(created, data = data1, geom = "bar",weight= retweetCount)and/or
cc1 = ggplot(data1, aes(created))
cc1 + geom_bar()
cc1 + geom_bar()
or
cc1 = ggplot(data1, aes(created))
cc1 + geom_histogram()
and/or
ggplot(data1, aes(data1$created,data1$retweetCount)) + geom_line()
Label
data1$month = sapply(data1$created, function(x) {p=as.POSIXlt(x);p$mon})
data1$hour = sapply(data1$created, function(x) {p=as.POSIXlt(x);p$hour})
data1$wday = sapply(data1$created, function(x) {p=as.POSIXlt(x);p$wday})
data1$year = sapply(data1$created, function(x) {p=as.POSIXlt(x);p$year})
data1$hour = sapply(data1$created, function(x) {p=as.POSIXlt(x);p$hour})
data1$wday = sapply(data1$created, function(x) {p=as.POSIXlt(x);p$wday})
data1$year = sapply(data1$created, function(x) {p=as.POSIXlt(x);p$year})
Make More Diagrams
ggplot(data1,aes(x=wday))+geom_histogram(aes(y = (..count..)),binwidth = 1)
and/or
ggplot(data4)+geom_bar(aes(x=wday))
and/or
ggplot(data1)+geom_jitter(aes(x=wday,y=hour))
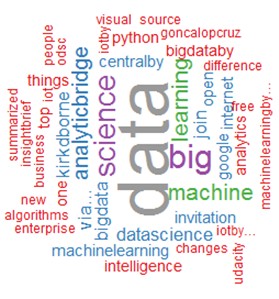
Word Cloud
Prepare Text
text1 = sapply(tweets1, function(x) x$getText())
text1 = tolower(text1)
text1 = gsub("rt", "", text1);
text1 = gsub("@\\w+", "", text1)
text1 = gsub("[[:punct:]]", "", text1)
text1 = gsub("http\\w+", "", text1)
text1 = gsub("[ |\t]{2,}", "", text1)
text1 = gsub("^ ", "", text1)
text1 = gsub(" $", "", text1)
Make Word Cloud
wordcloud(text1, min.freq = 1, scale=c(7,0.5), colors=brewer.pal(8, "Dark2"), random.color= TRUE, random.order = FALSE, max.words = 150)
Полный текст статьи, посвященный вопросам анализа коротких сообщений в Twitter и создании на их основе облака слов, находится здесь.


Comments
Post a Comment